Description
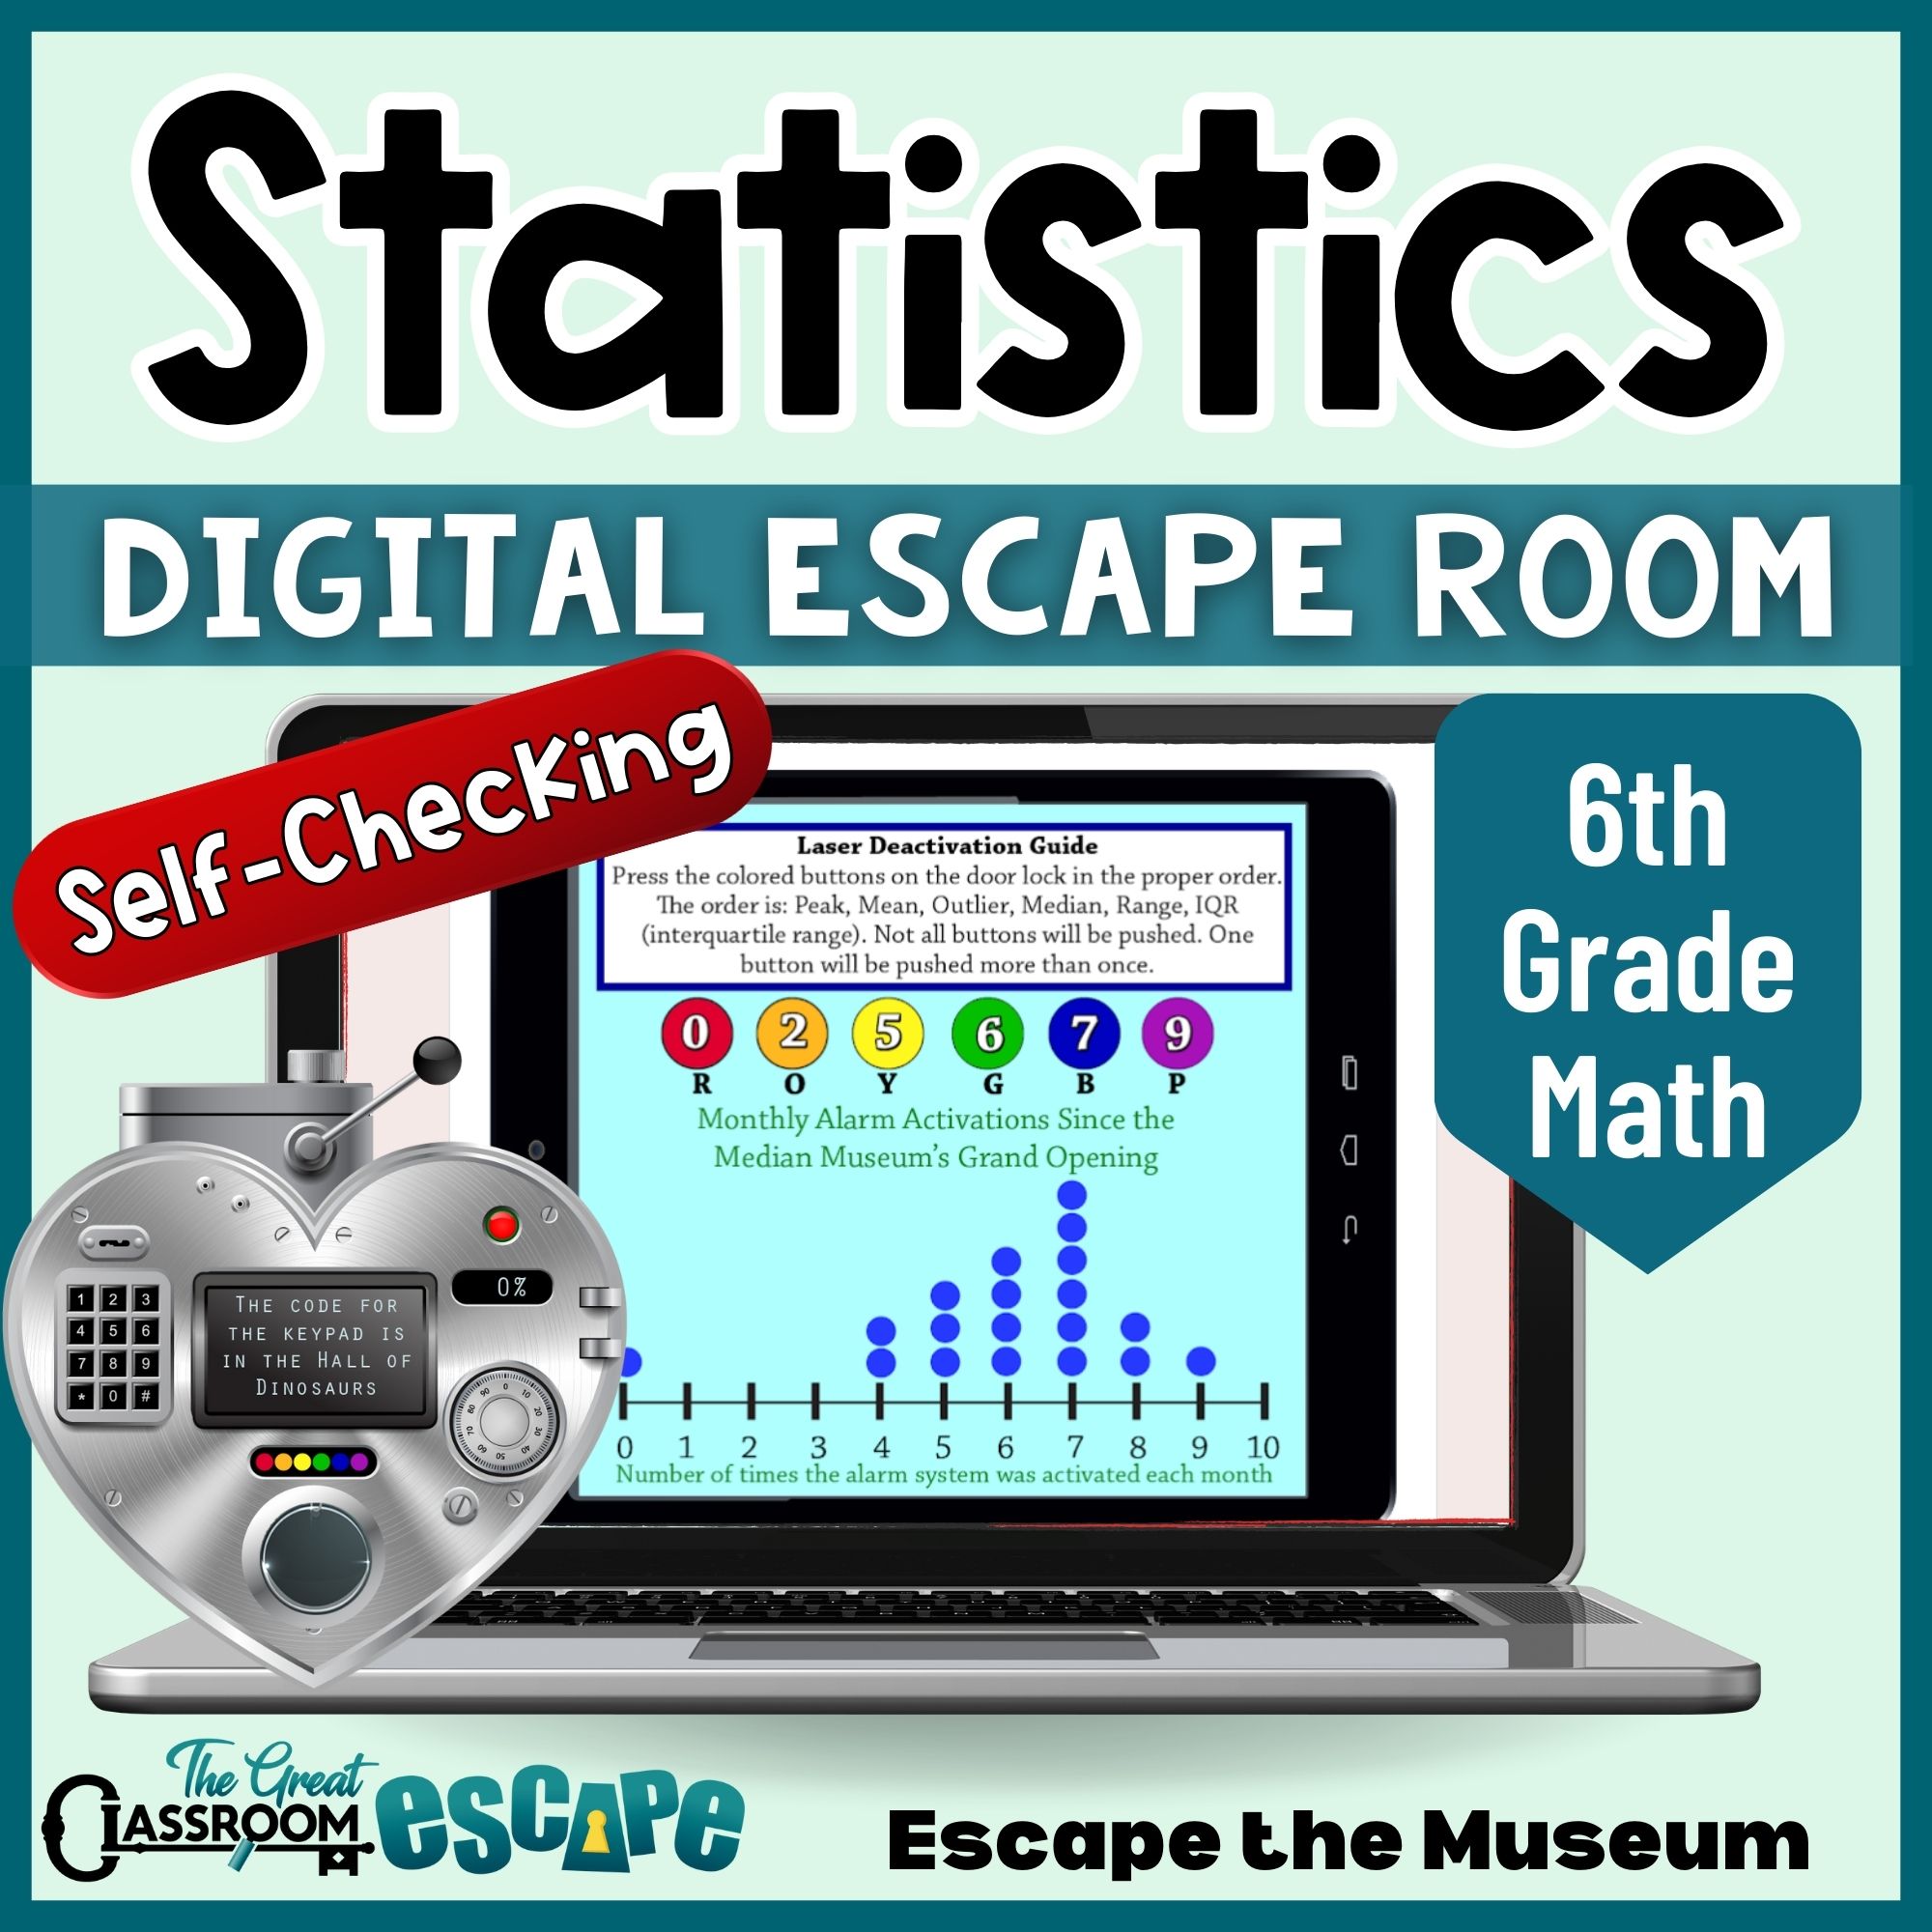
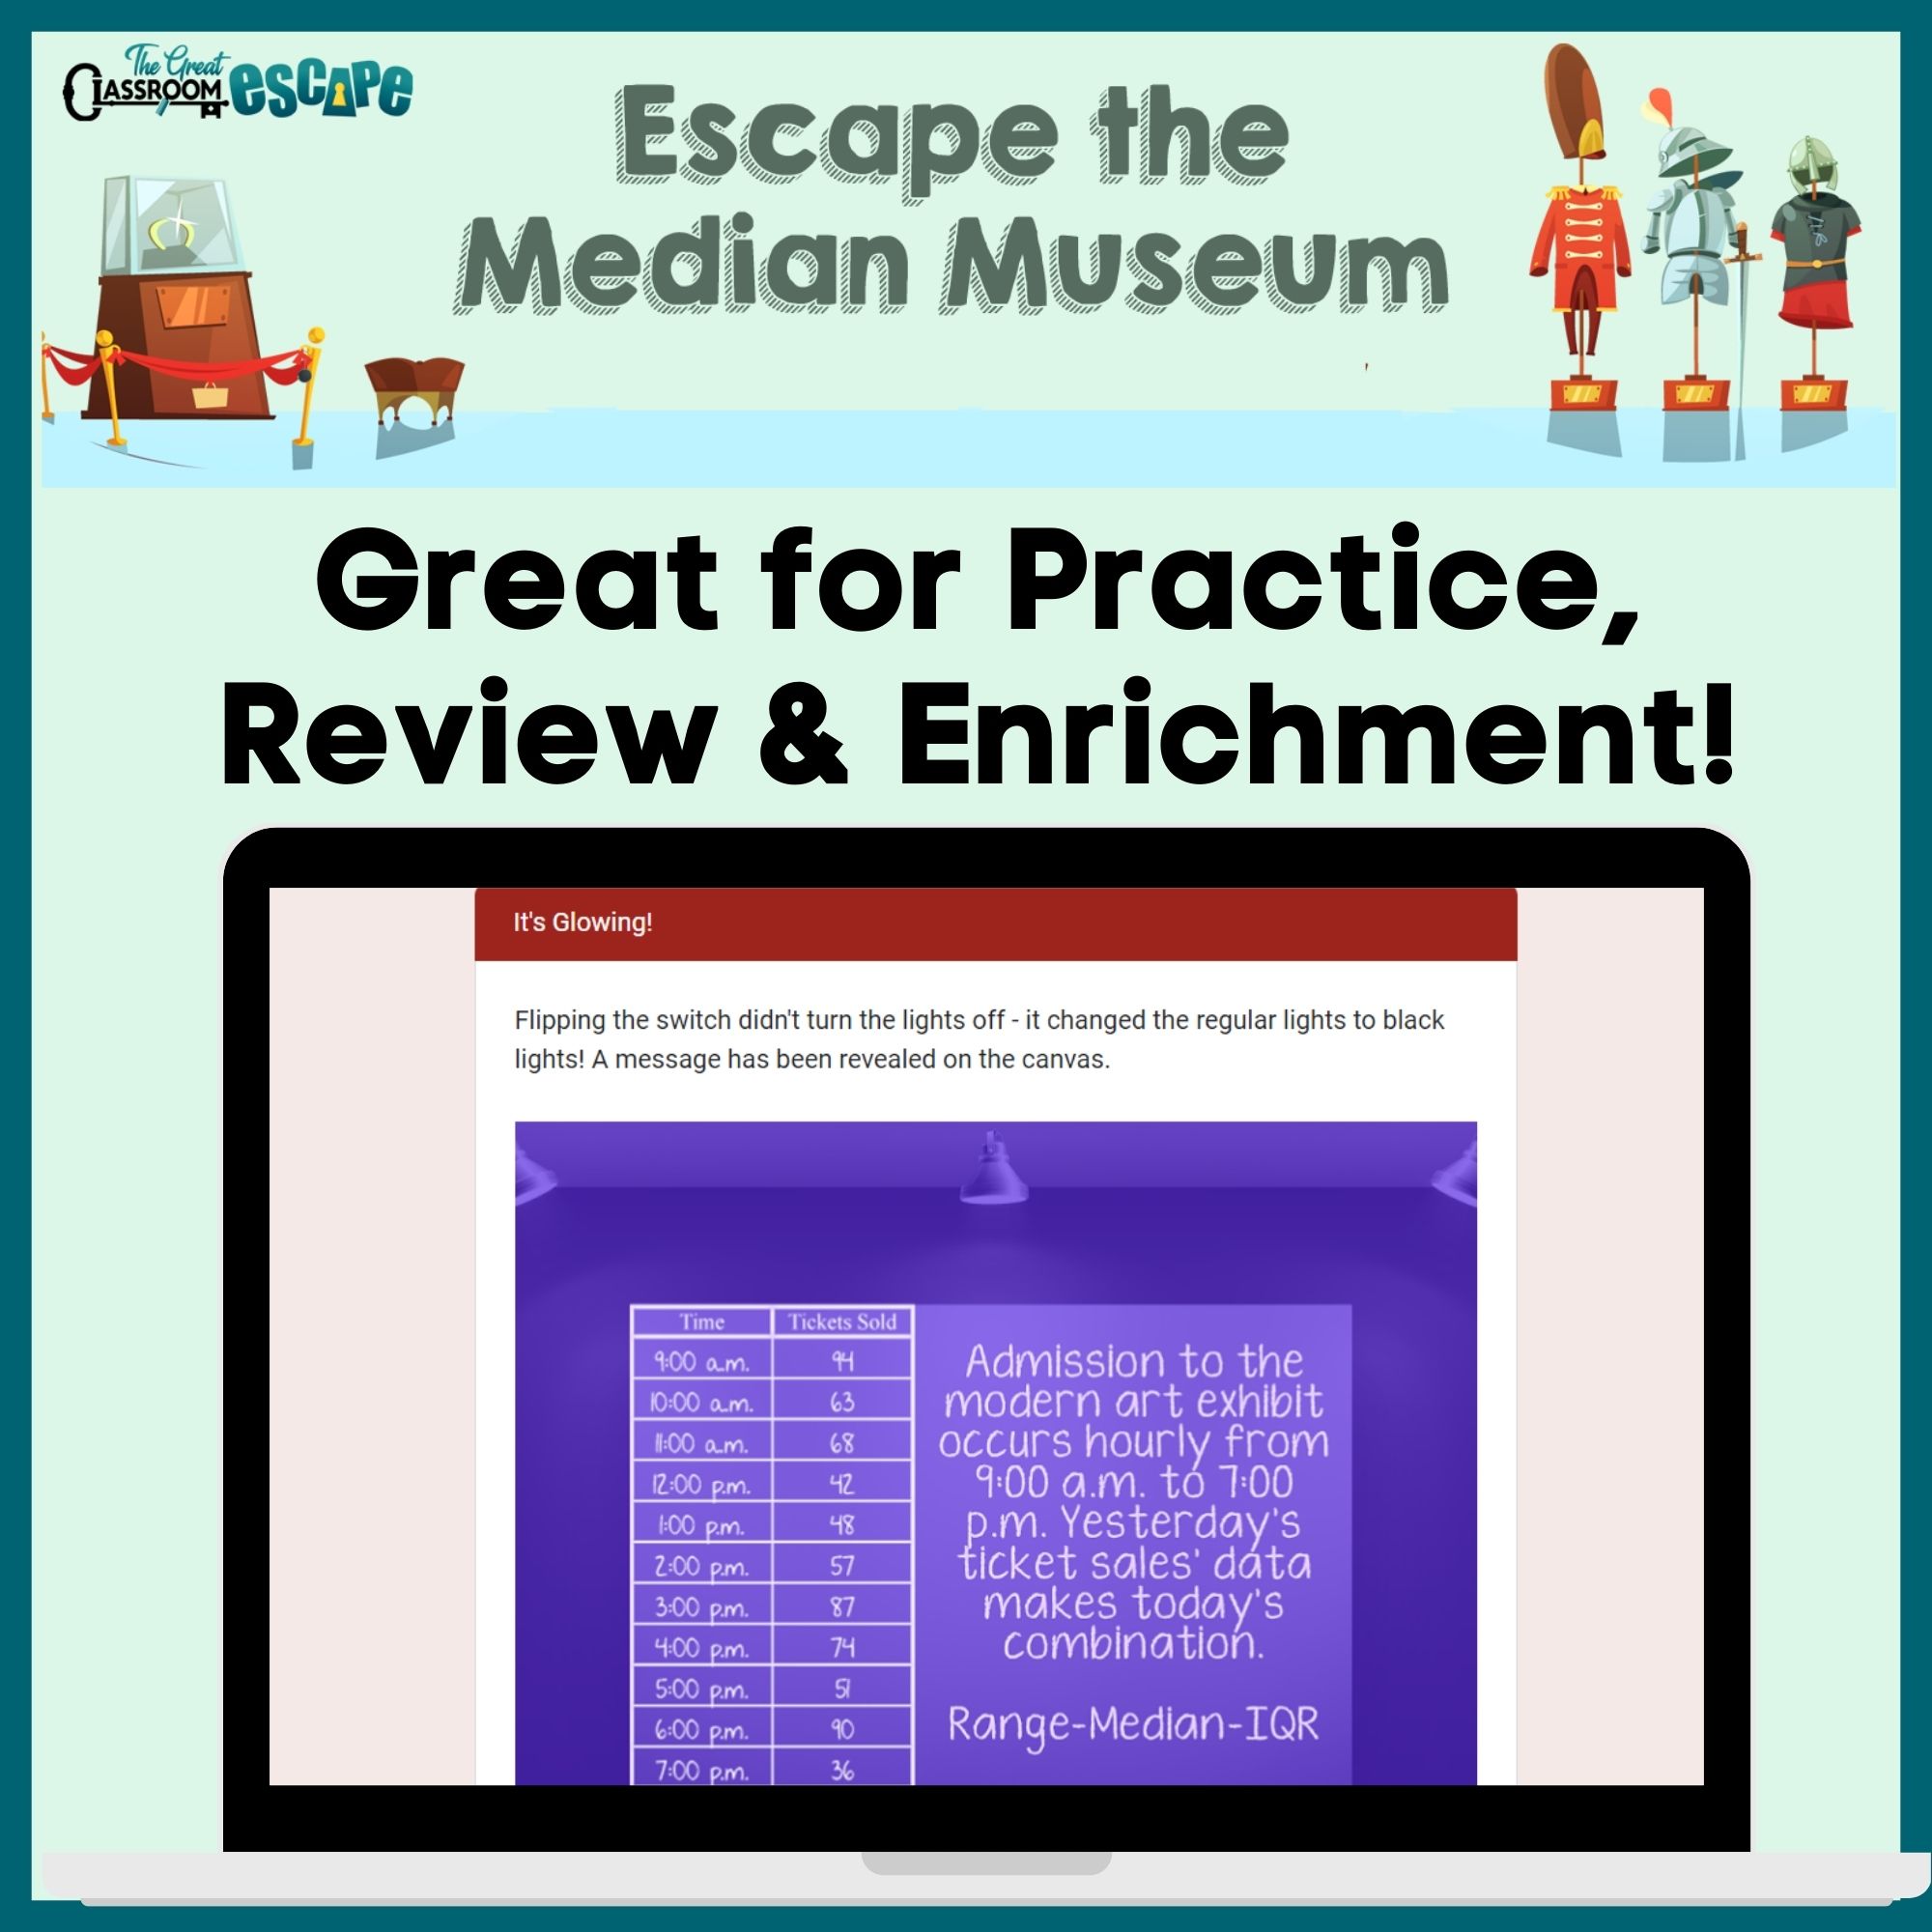
Statistics review can feel disconnected when students are moving among several measures and data displays. The Median Museum storyline ties those skills together: student docents are locked inside after the security system activates, and data analysis is the only way out.
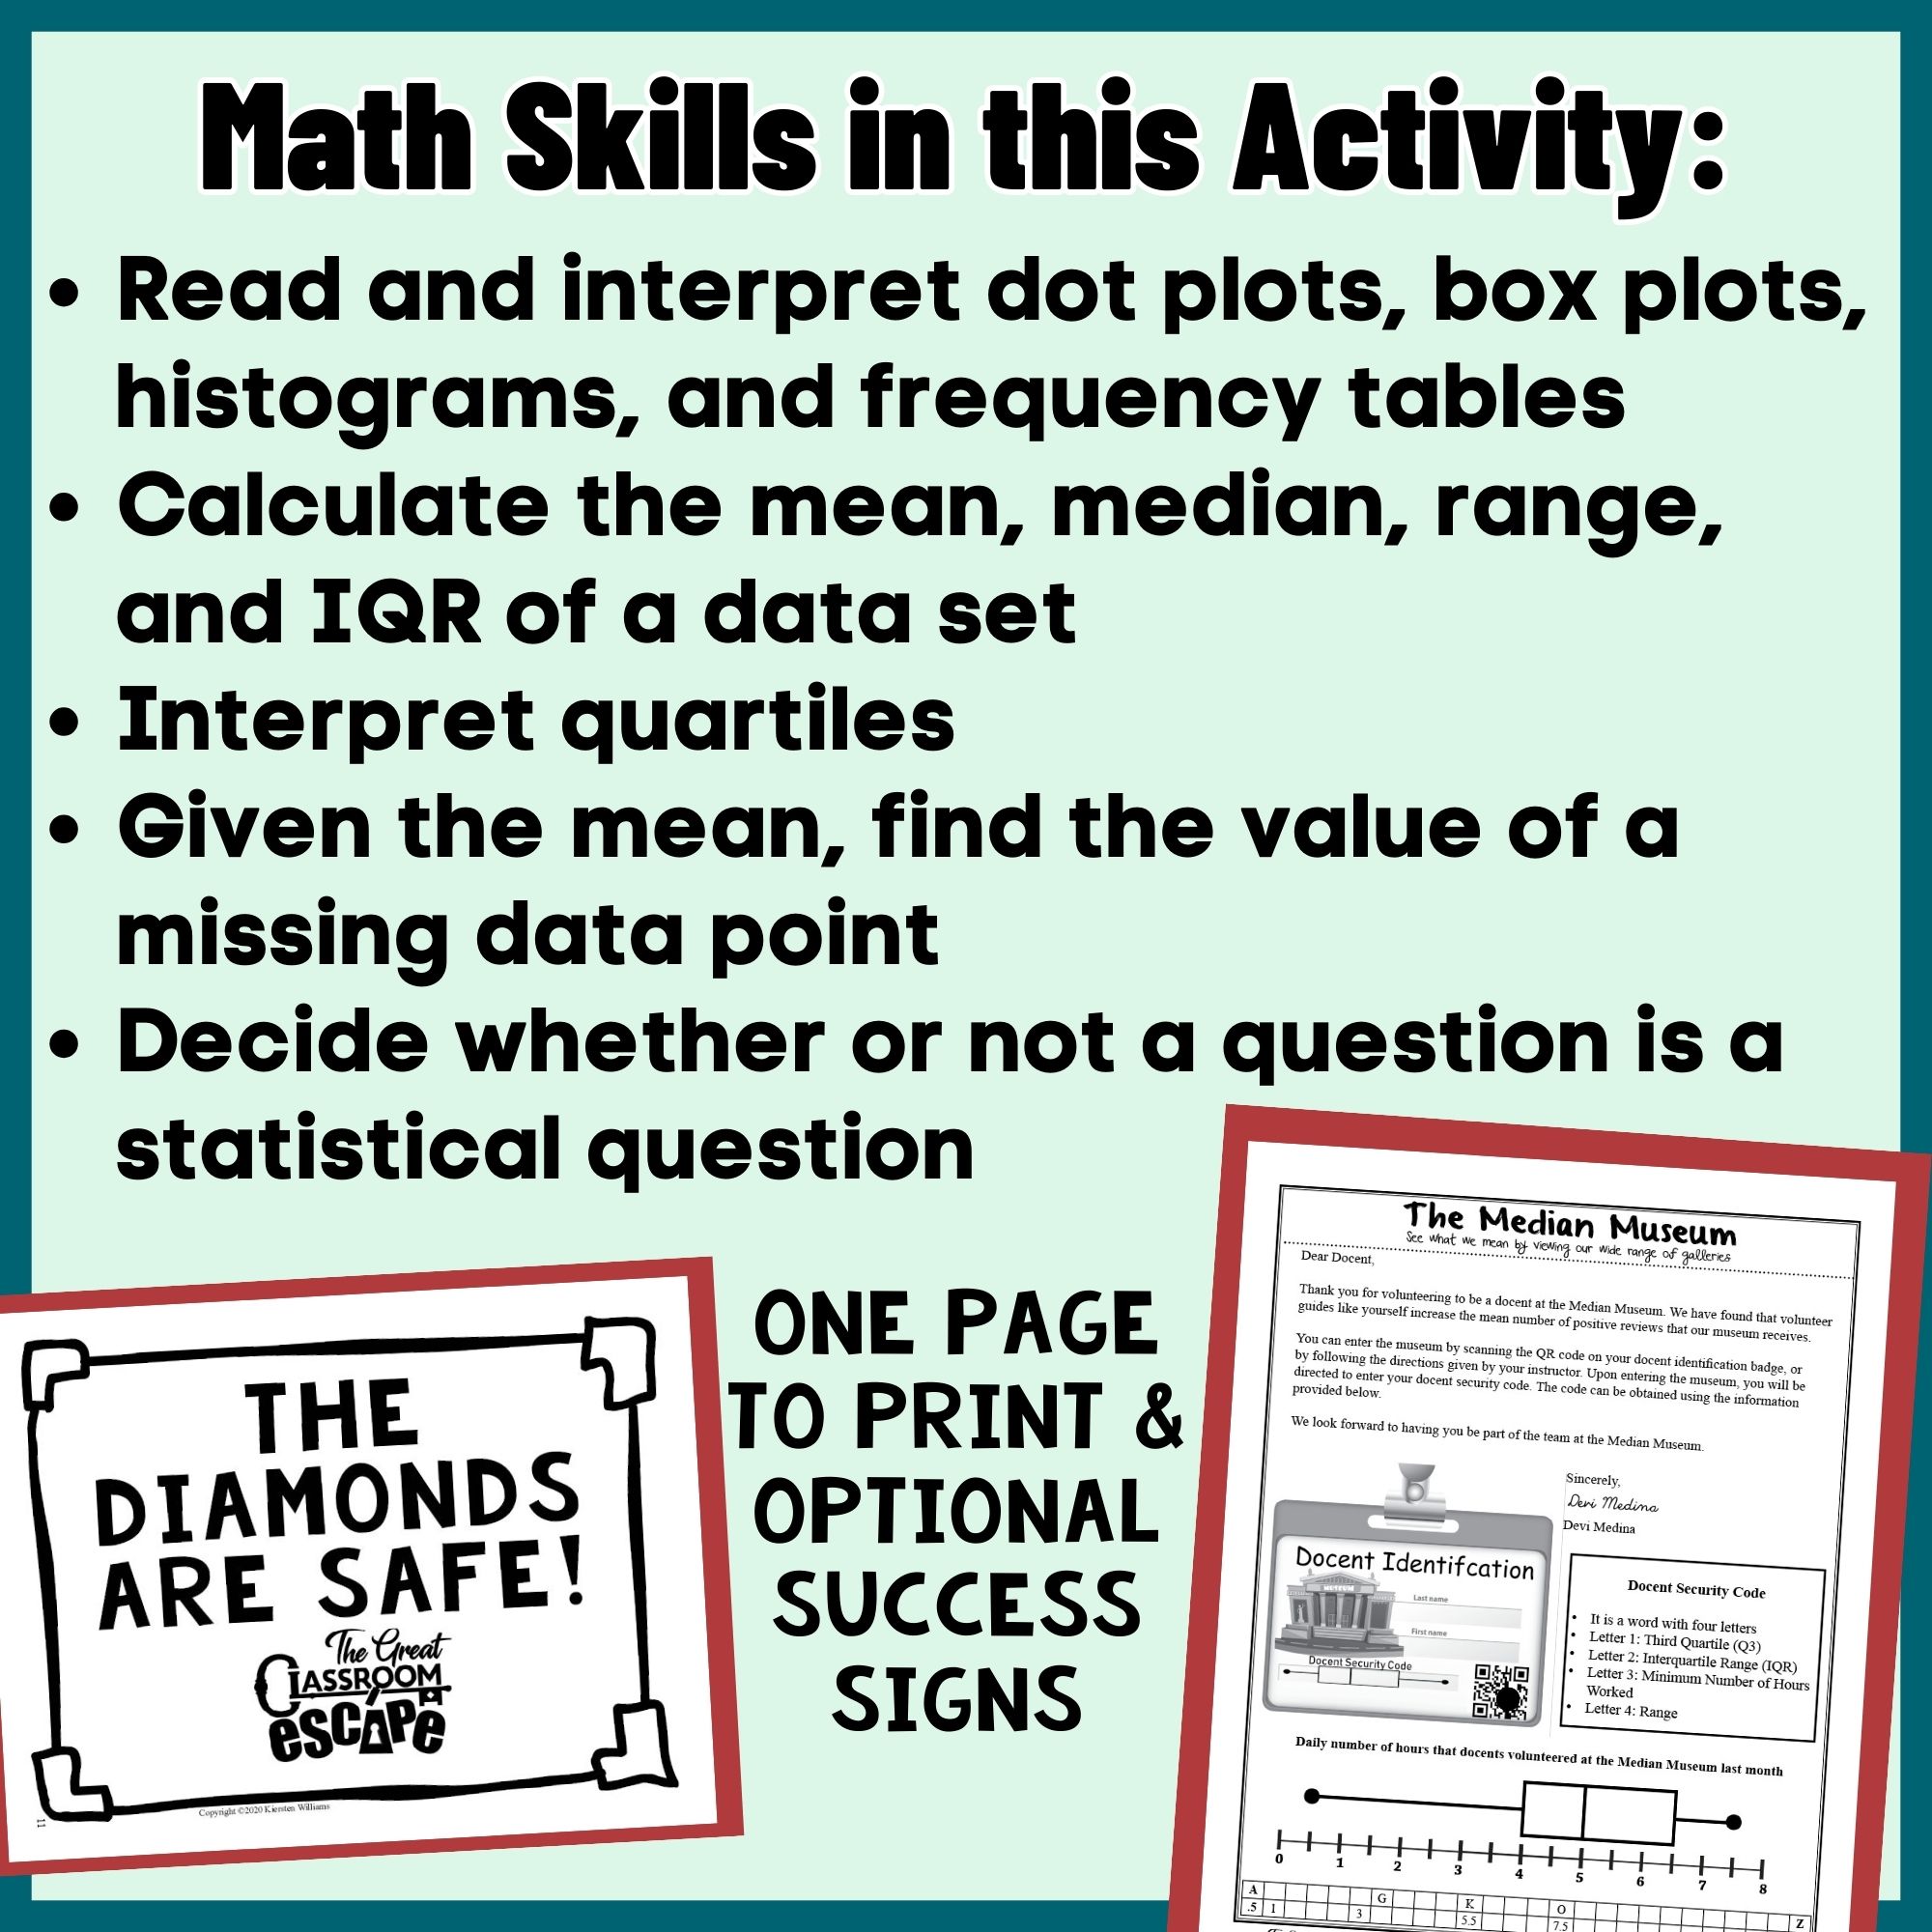
Math skills students will practice
- Reading and interpreting dot plots, box plots, histograms, and frequency tables
- Calculating mean, median, range, and interquartile range
- Interpreting quartiles
- Finding a missing data value when the mean is known
- Distinguishing statistical questions from non-statistical questions
- Solving basic logic puzzles
The activity brings together multiple 6.SP concepts and works well after students have learned the individual statistics skills.
Simple digital setup
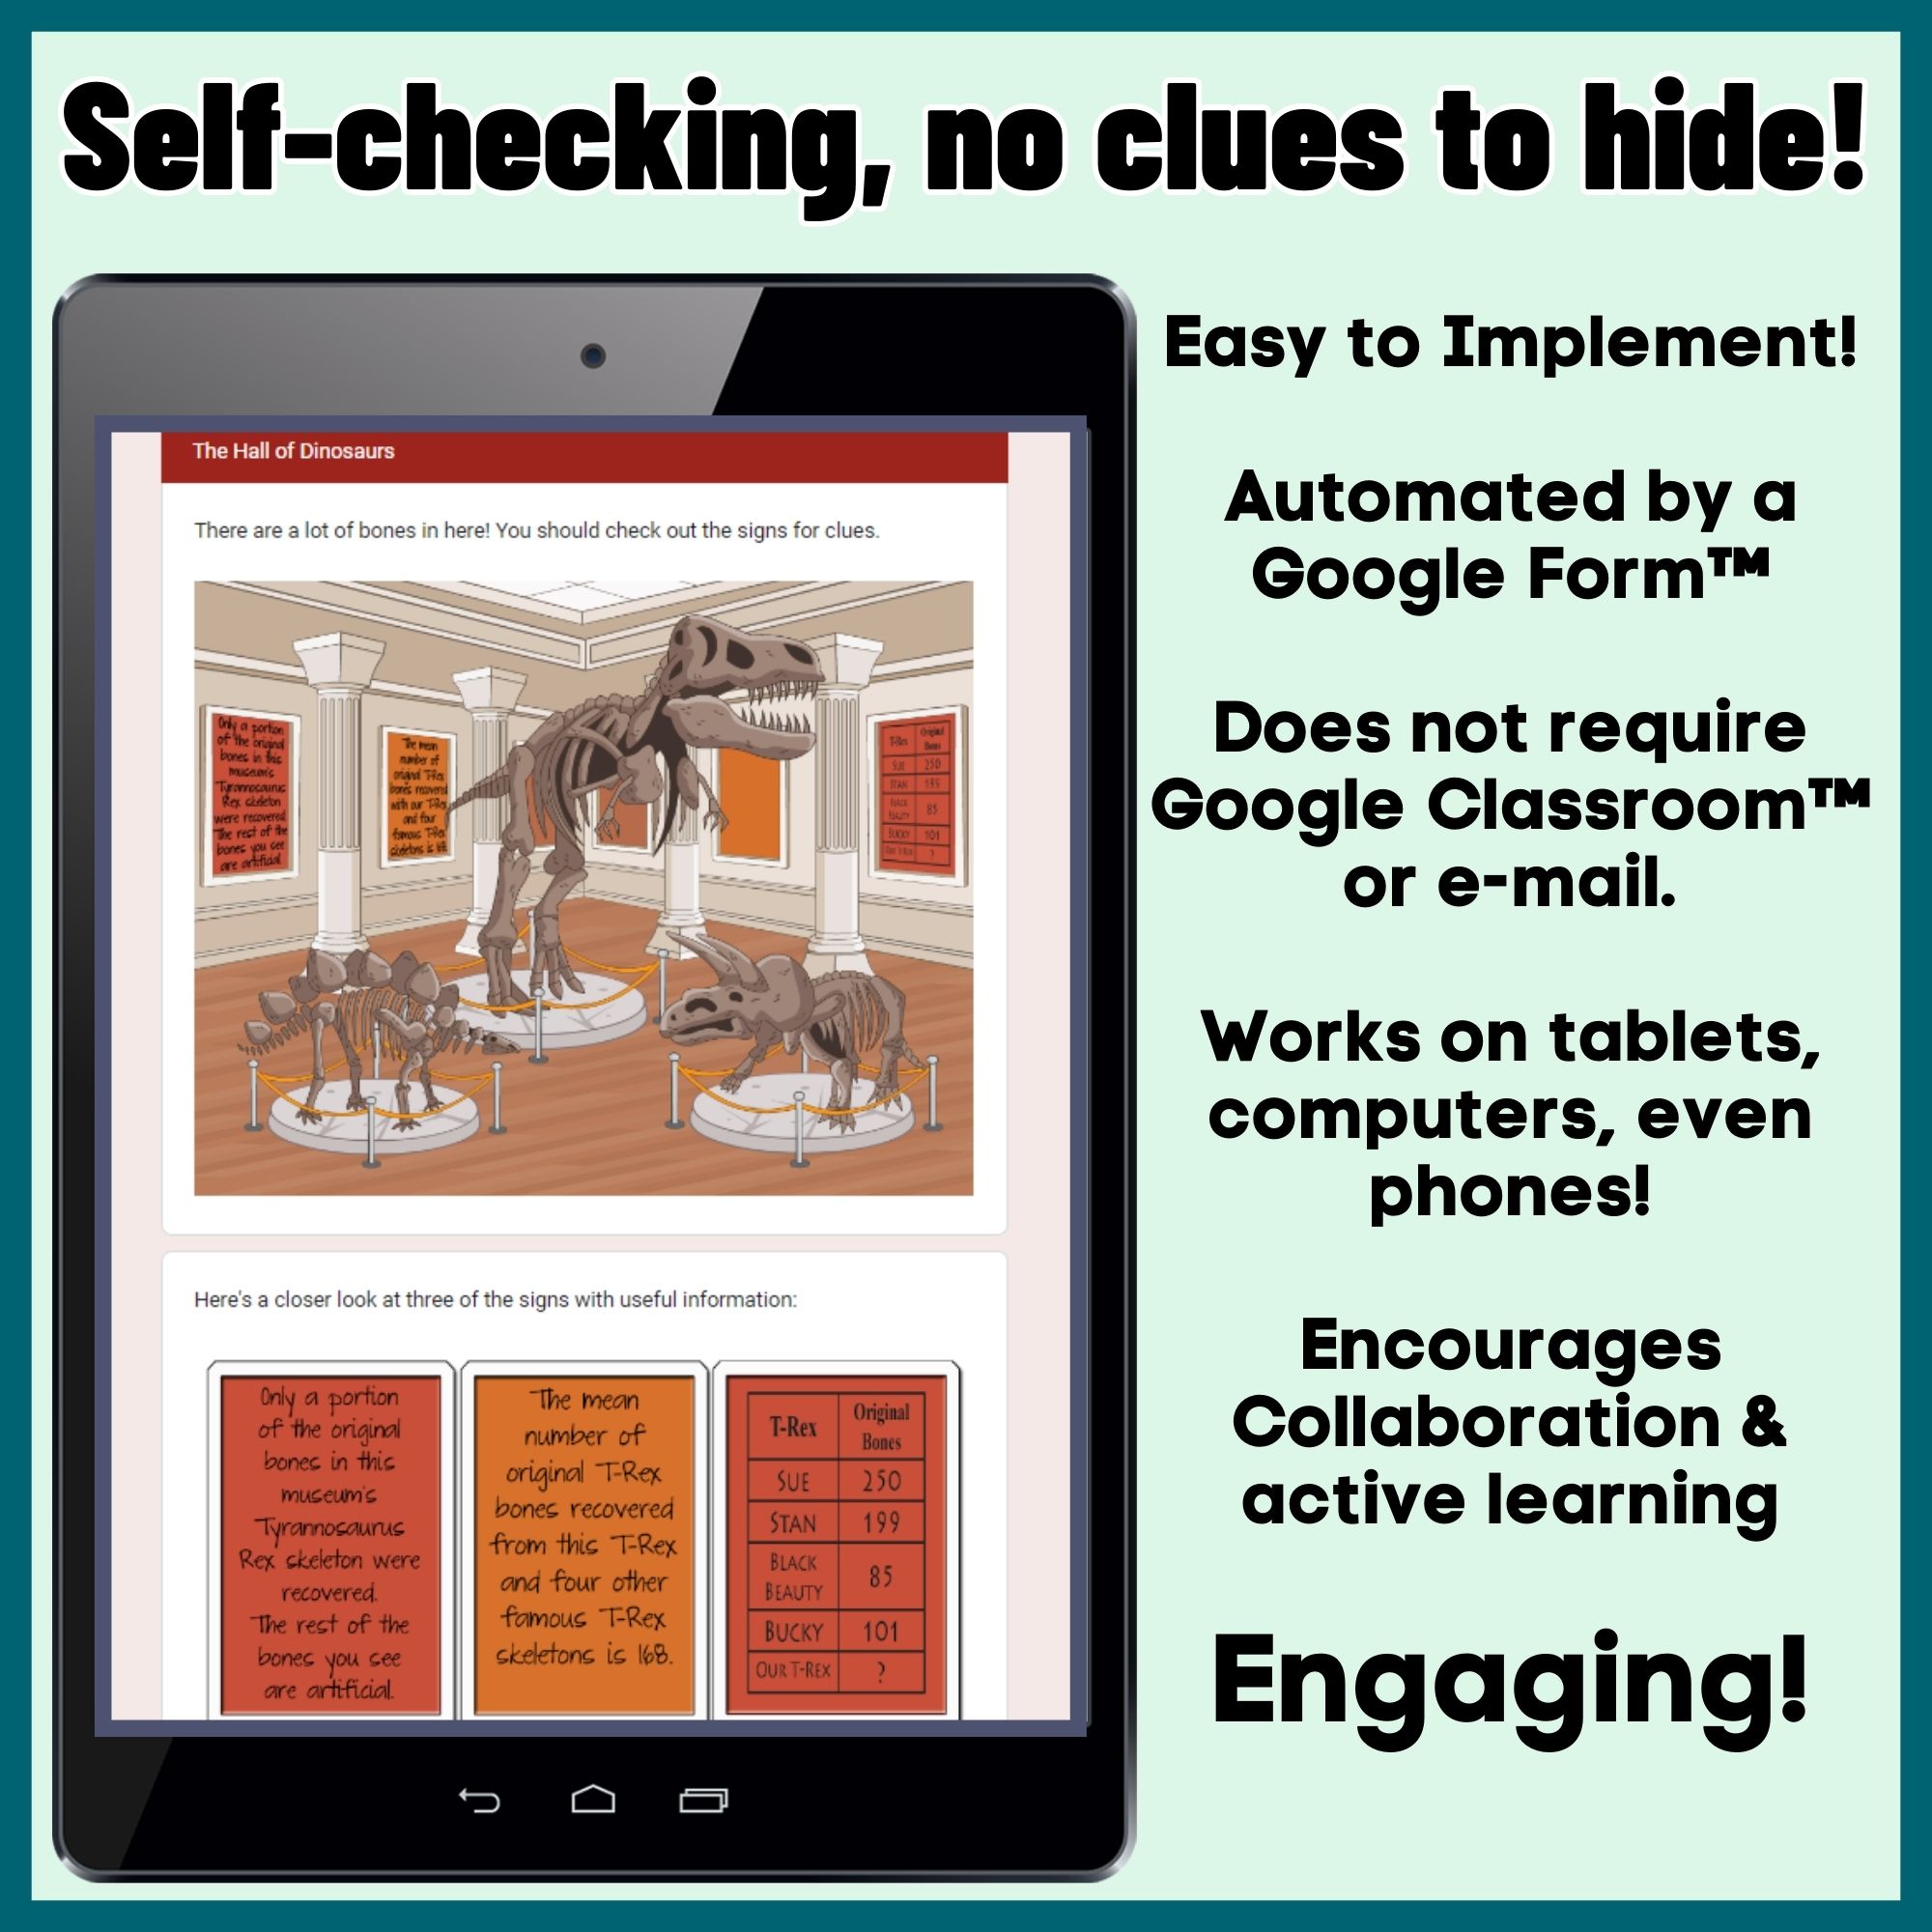
The breakout runs through Google Forms and is self-checking. Teachers print one starting case-file page for each group; it provides the backstory and QR code. The remainder of the activity is online, with no other clues to print or hide. Students do not need Google Drive or email accounts.
What is included
- Quick-start guide and detailed teacher directions
- One printable starting clue per group
- QR code and direct URL for the digital escape room
- Detailed answer key and teacher tips
- Optional Google Form copy link
- Optional success signs
Use Escape the Median Museum for end-of-unit review, test preparation, enrichment, a substitute day, or any time students need to connect several statistics concepts in one collaborative challenge.
Related practice: Continue with the 6th grade expressions and equations escape room.